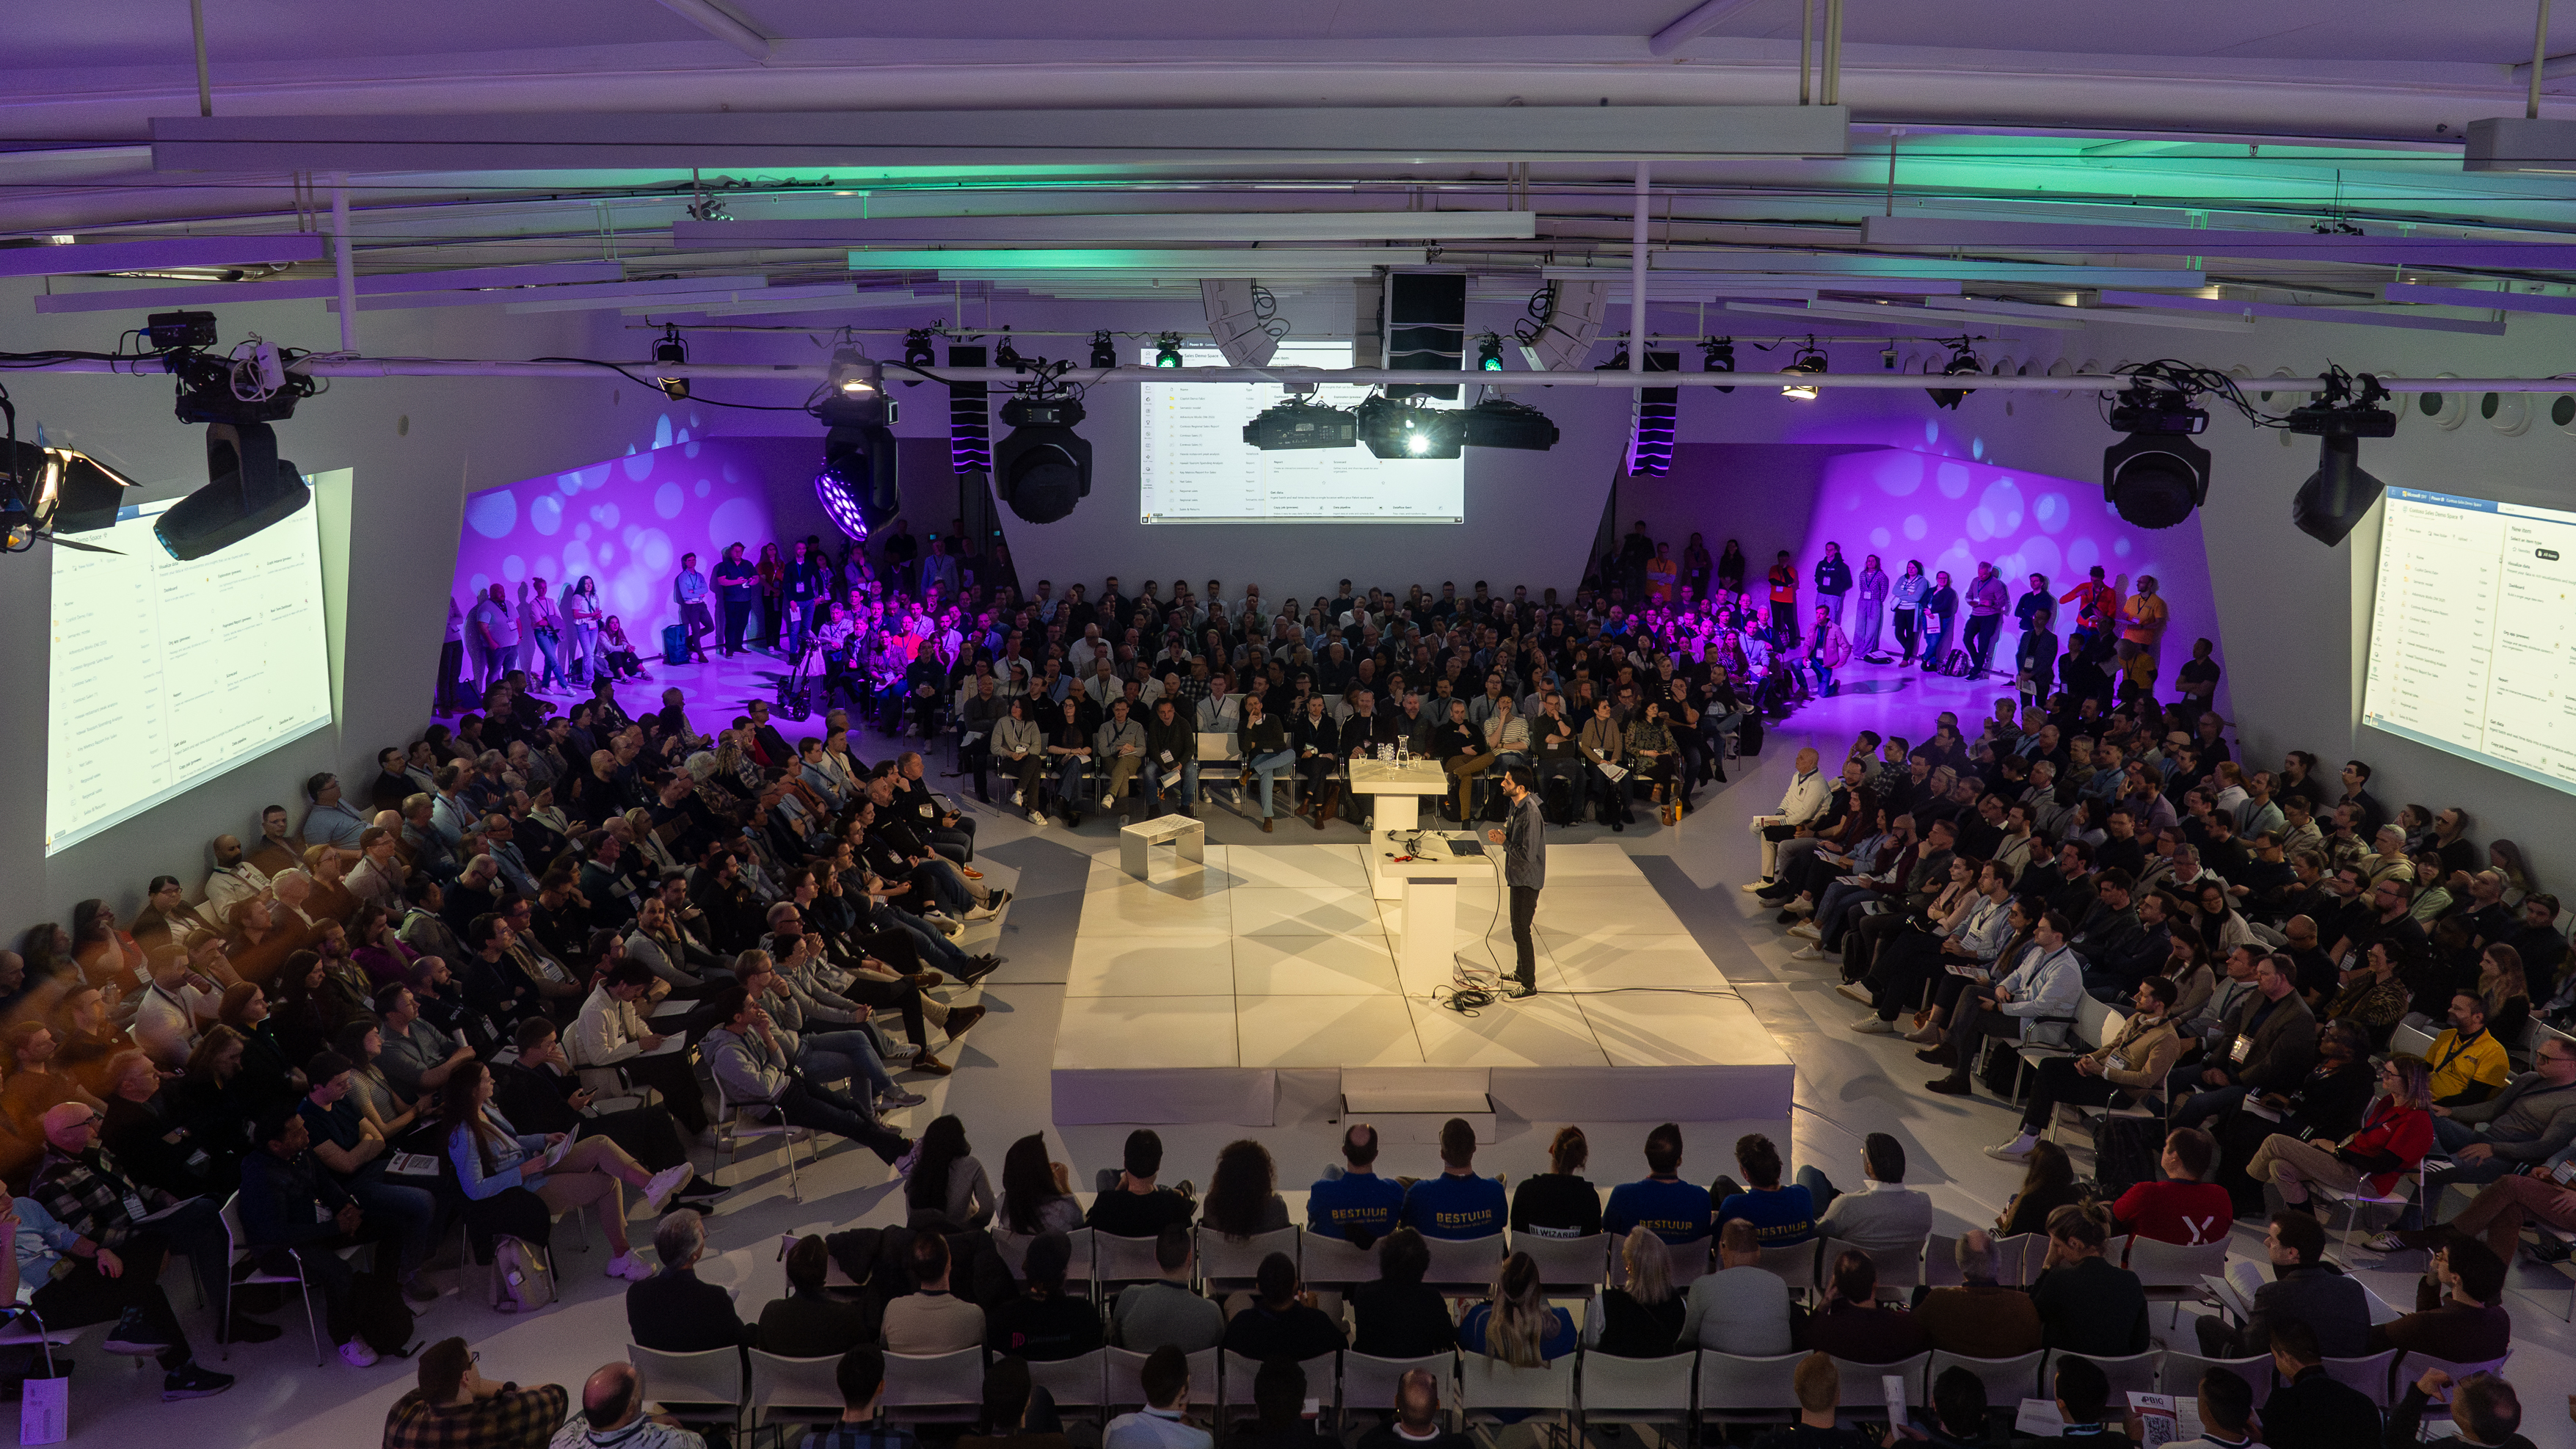
Power BI Gebruikersdagen 2025

  • Jaarbeurs Supernova
  • -
  • - uur
00 Maanden
00 Dagen
00 Uren
00 Minuten
00 Seconden

Omschrijving

*english text below*

6,7 en 8 maart

Op donderdag 6 maart organiseren we Precon Thursday, een dag speciaal gewijd aan pre-conferentie trainingen. Je kunt kiezen uit één van de zeven tracks, waarbij elke track een volledige dag van 8 uur duurt. Dit biedt je de kans om diep in een specifiek onderwerp te duiken en je vaardigheden naar een hoger niveau te tillen.

Op vrijdag 7 maart staat Deep Dive Friday op het programma. Deze dag biedt een scala aan sessies van 90 minuten, verzorgd door gerenommeerde sprekers. Dit is jouw kans om diepgaande inzichten te verkrijgen in uiteenlopende onderwerpen binnen Power BI en gerelateerde technologieën.

Het hoogtepunt van het evenement is Community Saturday op zaterdag 8 maart. Het programma bestaat uit technische sessies, praktijkcases en presentaties over de nieuwste ontwikkelingen rondom Power BI. Deze sessies worden gegeven door zowel internationale als Nederlandse experts. Na de inspirerende keynote zijn er zeven parallelle tracks om uit te kiezen.

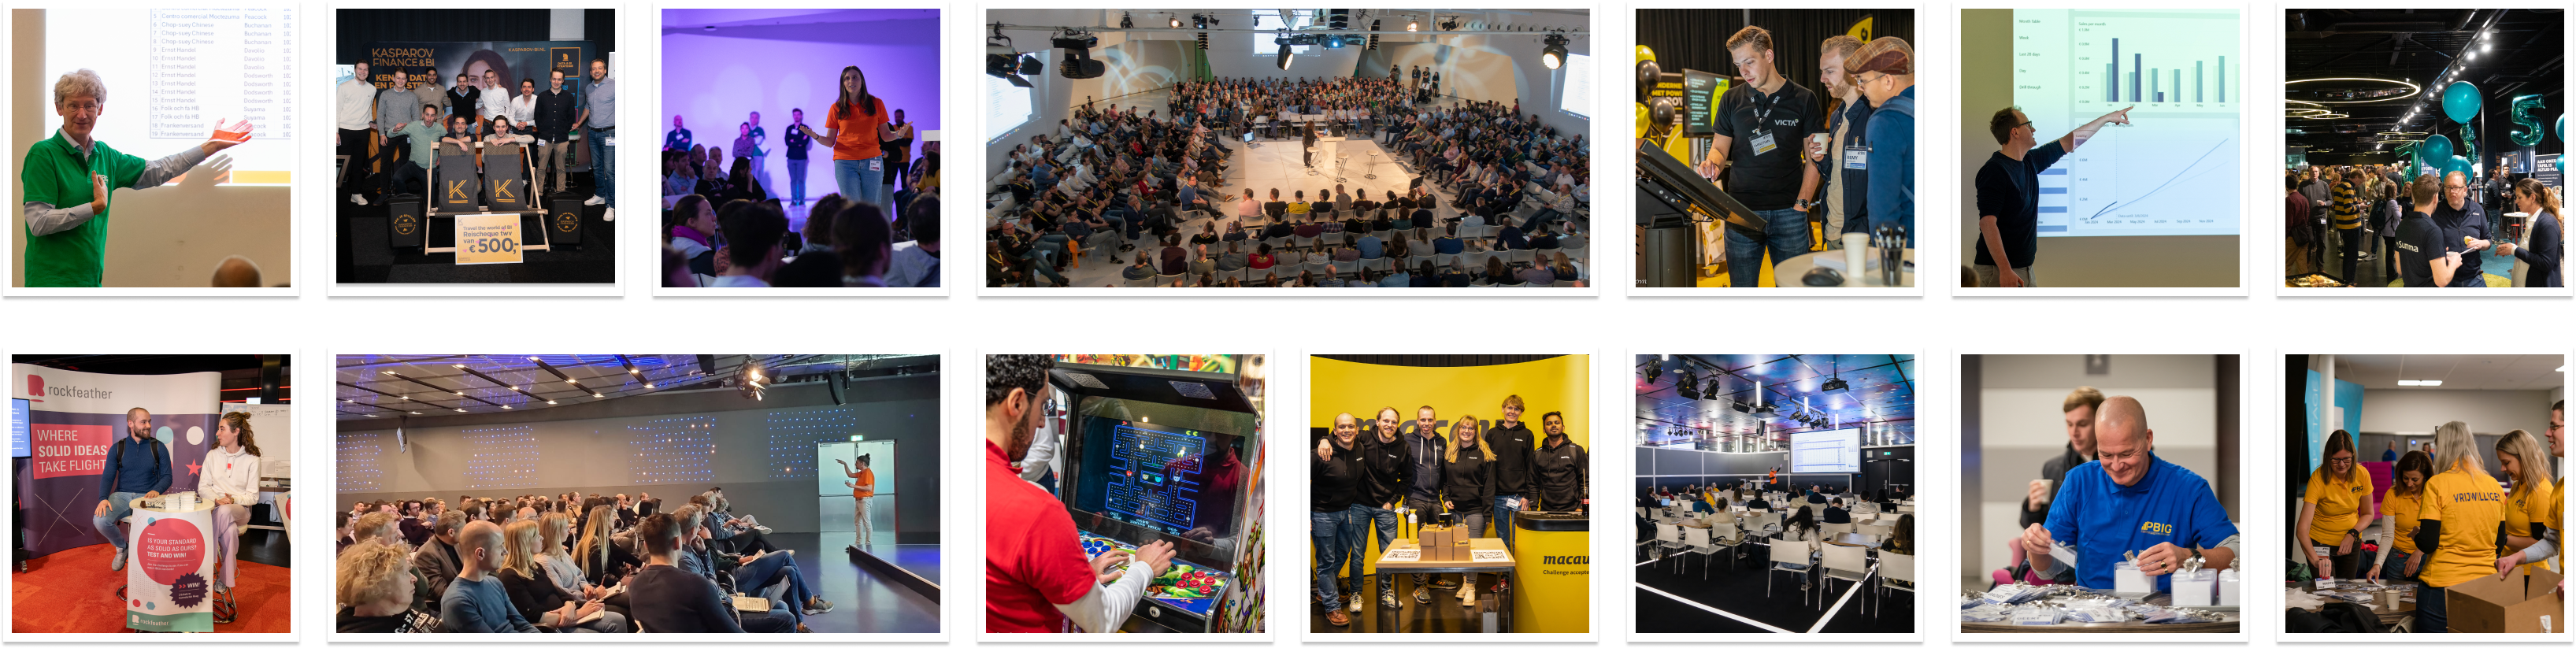
Op vrijdag en zaterdag is er volop gelegenheid om de stands van onze partners te bezoeken. Met ruime pauzes tussen de sessies en een heerlijke lunch wordt gezorgd voor voldoende momenten om te netwerken en in contact te komen met het publiek.

We kijken ernaar uit om je te verwelkomen op deze bijzondere dagen vol kennisdeling en inspiratie rondom Power BI!


March 6,7 and 8th

On Thursday, March 6, we’re hosting Precon Thursday, a day dedicated to pre-conference training. You can choose from one of seven tracks, each offering a full-day session of 8 hours. This is your opportunity to deep-dive into a specific topic and elevate your skills to the next level.

On Friday, March 7, it’s time for Deep Dive Friday, featuring a range of 90-minute sessions led by renowned speakers. This is your chance to gain in-depth insights into various topics within Power BI and related technologies.

The highlight of the event is Community Saturday on Saturday, March 8. The program includes technical sessions, practical case studies, and presentations on the latest developments in Power BI. These sessions are delivered by both international and Dutch experts. After the inspiring keynote, there will be seven parallel tracks to choose from.

On Friday and Saturday, you’ll have plenty of opportunities to visit our partners' stands. With generous breaks between sessions and a delicious lunch, there’s ample time to network and connect with other attendees.

We look forward to welcoming you to these inspiring days full of knowledge sharing and insights into Power BI!


Schema

  1. 🇬🇧 Precon - Power BI & Fabric Gov/Admin Insights
  2. 🇬🇧 Precon - Deneb Dashboard in a Day
  3. 🇬🇧 Precon- PowerBI Report Design & Dev workshop
  4. 🇳🇱 Precon - Nieuwe oplossingen voor complexe DAX
  5. 🇳🇱 Precon - PowerBI datamodelleren
  6. 🇬🇧 Precon - A Real-time Fabric Solution in a Day
  7. 🇬🇧 Precon - Power Up Skills with Power BI

  1. 🇬🇧 What's new in DAX
  2. 🇬🇧 Optimizing Your Power BI Workflow with Project Files, Source Control, and TMDL
  3. 🇬🇧 Understanding CALCULATE, the queen of all DAX functions
  4. 🇬🇧 Build A Fabric Real-time Intelligence Solution in One Day (Deepdive edition)
  5. 🇬🇧 What Fabric means for your Power BI semantic models - Deep dive edition
  6. 🇬🇧 Powering Up Your Power BI Development Workflow with Microsoft Fabric Notebooks
  7. 🇳🇱 Bouw het datamodel waar je Power users van dromen!
  8. 🇳🇱 The three layers of dashboard design - 2 hour edition
  9. 🇳🇱 Financiële rapportages in Power BI met standaard visuals
  10. 🇬🇧 Visualizing Data for Non-Data Experts: Making Reports Accessible to All
  11. 🇬🇧 All about Calculation Groups
  12. 🇬🇧 Simplify your DAX with window functions
  13. 🇬🇧 Govern your Data on Fabric and Beyond
  14. 🇬🇧 Next-step data access security in Power BI
  15. 🇬🇧 Embedding Power BI reports on your own portal
  16. 🇬🇧 Your ultimate guide to consuming content in Power BI & Fabric
  17. 🇬🇧 Automate tenant monitoring and documentation using scanner api
  18. 🇬🇧 Mastering Power BI development with the help of External Tools
  19. 🇳🇱 Van Data naar Dashboard powered by AI: Power BI Best Practices

  1. 🇬🇧 Build Power BI reports that people actually use
  2. 🇳🇱 Creativity on Demand for the BI geek
  3. 🇬🇧 Star Schema ALL the things! But why?
  4. 🇳🇱 How A.R.T. can help you communicate data
  5. 🇳🇱 Bolletje - Praktische productiedata-analyse met Power BI
  6. 🇬🇧 Hybrid tables in Power BI
  7. 🇬🇧 Your ultimate guide to consuming content in Power BI & Fabric
  8. 🇬🇧 Leverage Power Query to get data from Rest APIs
  9. 🇳🇱 Zorgverzekeraar Menzis en Power BI
  10. 🇬🇧 What Fabric means for your Power BI semantic models
  11. 🇳🇱 PowerBI Metric Sets - verder op weg naar Self Service BI
  12. 🇬🇧 Intuitive totals in Power BI
  13. 🇳🇱 Één dashboard en vele meningen: hoe maak je één centraal dashboard voor 30 verschillende werkwijzen?
  14. 🇬🇧 Microsoft Fabric, Lakehouses and Power BI: A guide for BI developers
  15. 🇳🇱 Excel naar Power BI: De essentials voor een efficiënte integratie
  16. 🇳🇱 Datamodellering voor Snellere Power BI Dashboards: De Sleutel tot Prestatieverbetering
  17. 🇬🇧 Understanding the most important concept in DAX: Evaluation Context
  18. 🇳🇱 AI + BI = CI (Combined Intelligence)
  19. 🇬🇧 Chromalloy - Where Business meets PowerBI
  20. 🇬🇧 Organizing Microsoft Fabric Adoption
  21. 🇬🇧 Scenario planning with what-if parameters
  22. 🇬🇧 What's new in DAX
  23. 🇳🇱 ABN AMRO - De Power BI-reis van 0 naar 20.000 ...
  24. 🇬🇧 From reports to chatbots! Changing the way how we interact with data
  25. 🇬🇧 Manage and monitor your Fabric tenant using the Admin monitoring workspace
  26. 🇳🇱 Power BI + Fabric Dataflows introductie
  27. 🇬🇧 Applying DevOps practices to your Power BI deployments in Microsoft Fabric
  28. 🇳🇱 De Amsterdamse Aanpak
  29. 🇬🇧 ABC's of the Power BI REST API
  30. 🇬🇧 Understanding DAX Pillars
  31. 🇬🇧 Using Tabular Editor and best practices to speed up Power BI development - a live demo
  32. 🇳🇱 10 tips voor het bouwen van een gebruiksvriendelijk dashboard
  33. 🇬🇧 Learn how to promote and reuse key metrics from your semantic models across your organization
  34. 🇬🇧 Storytelling & Power BI - Creating Power BI reports that connect with different audiences
  35. 🇬🇧 Mastering Composite Models: Power BI for the Self-Service Developer

Sprekers

Kaarten